Methods
Students Become
Scientists
True learning relies on methods done by professional scientists.
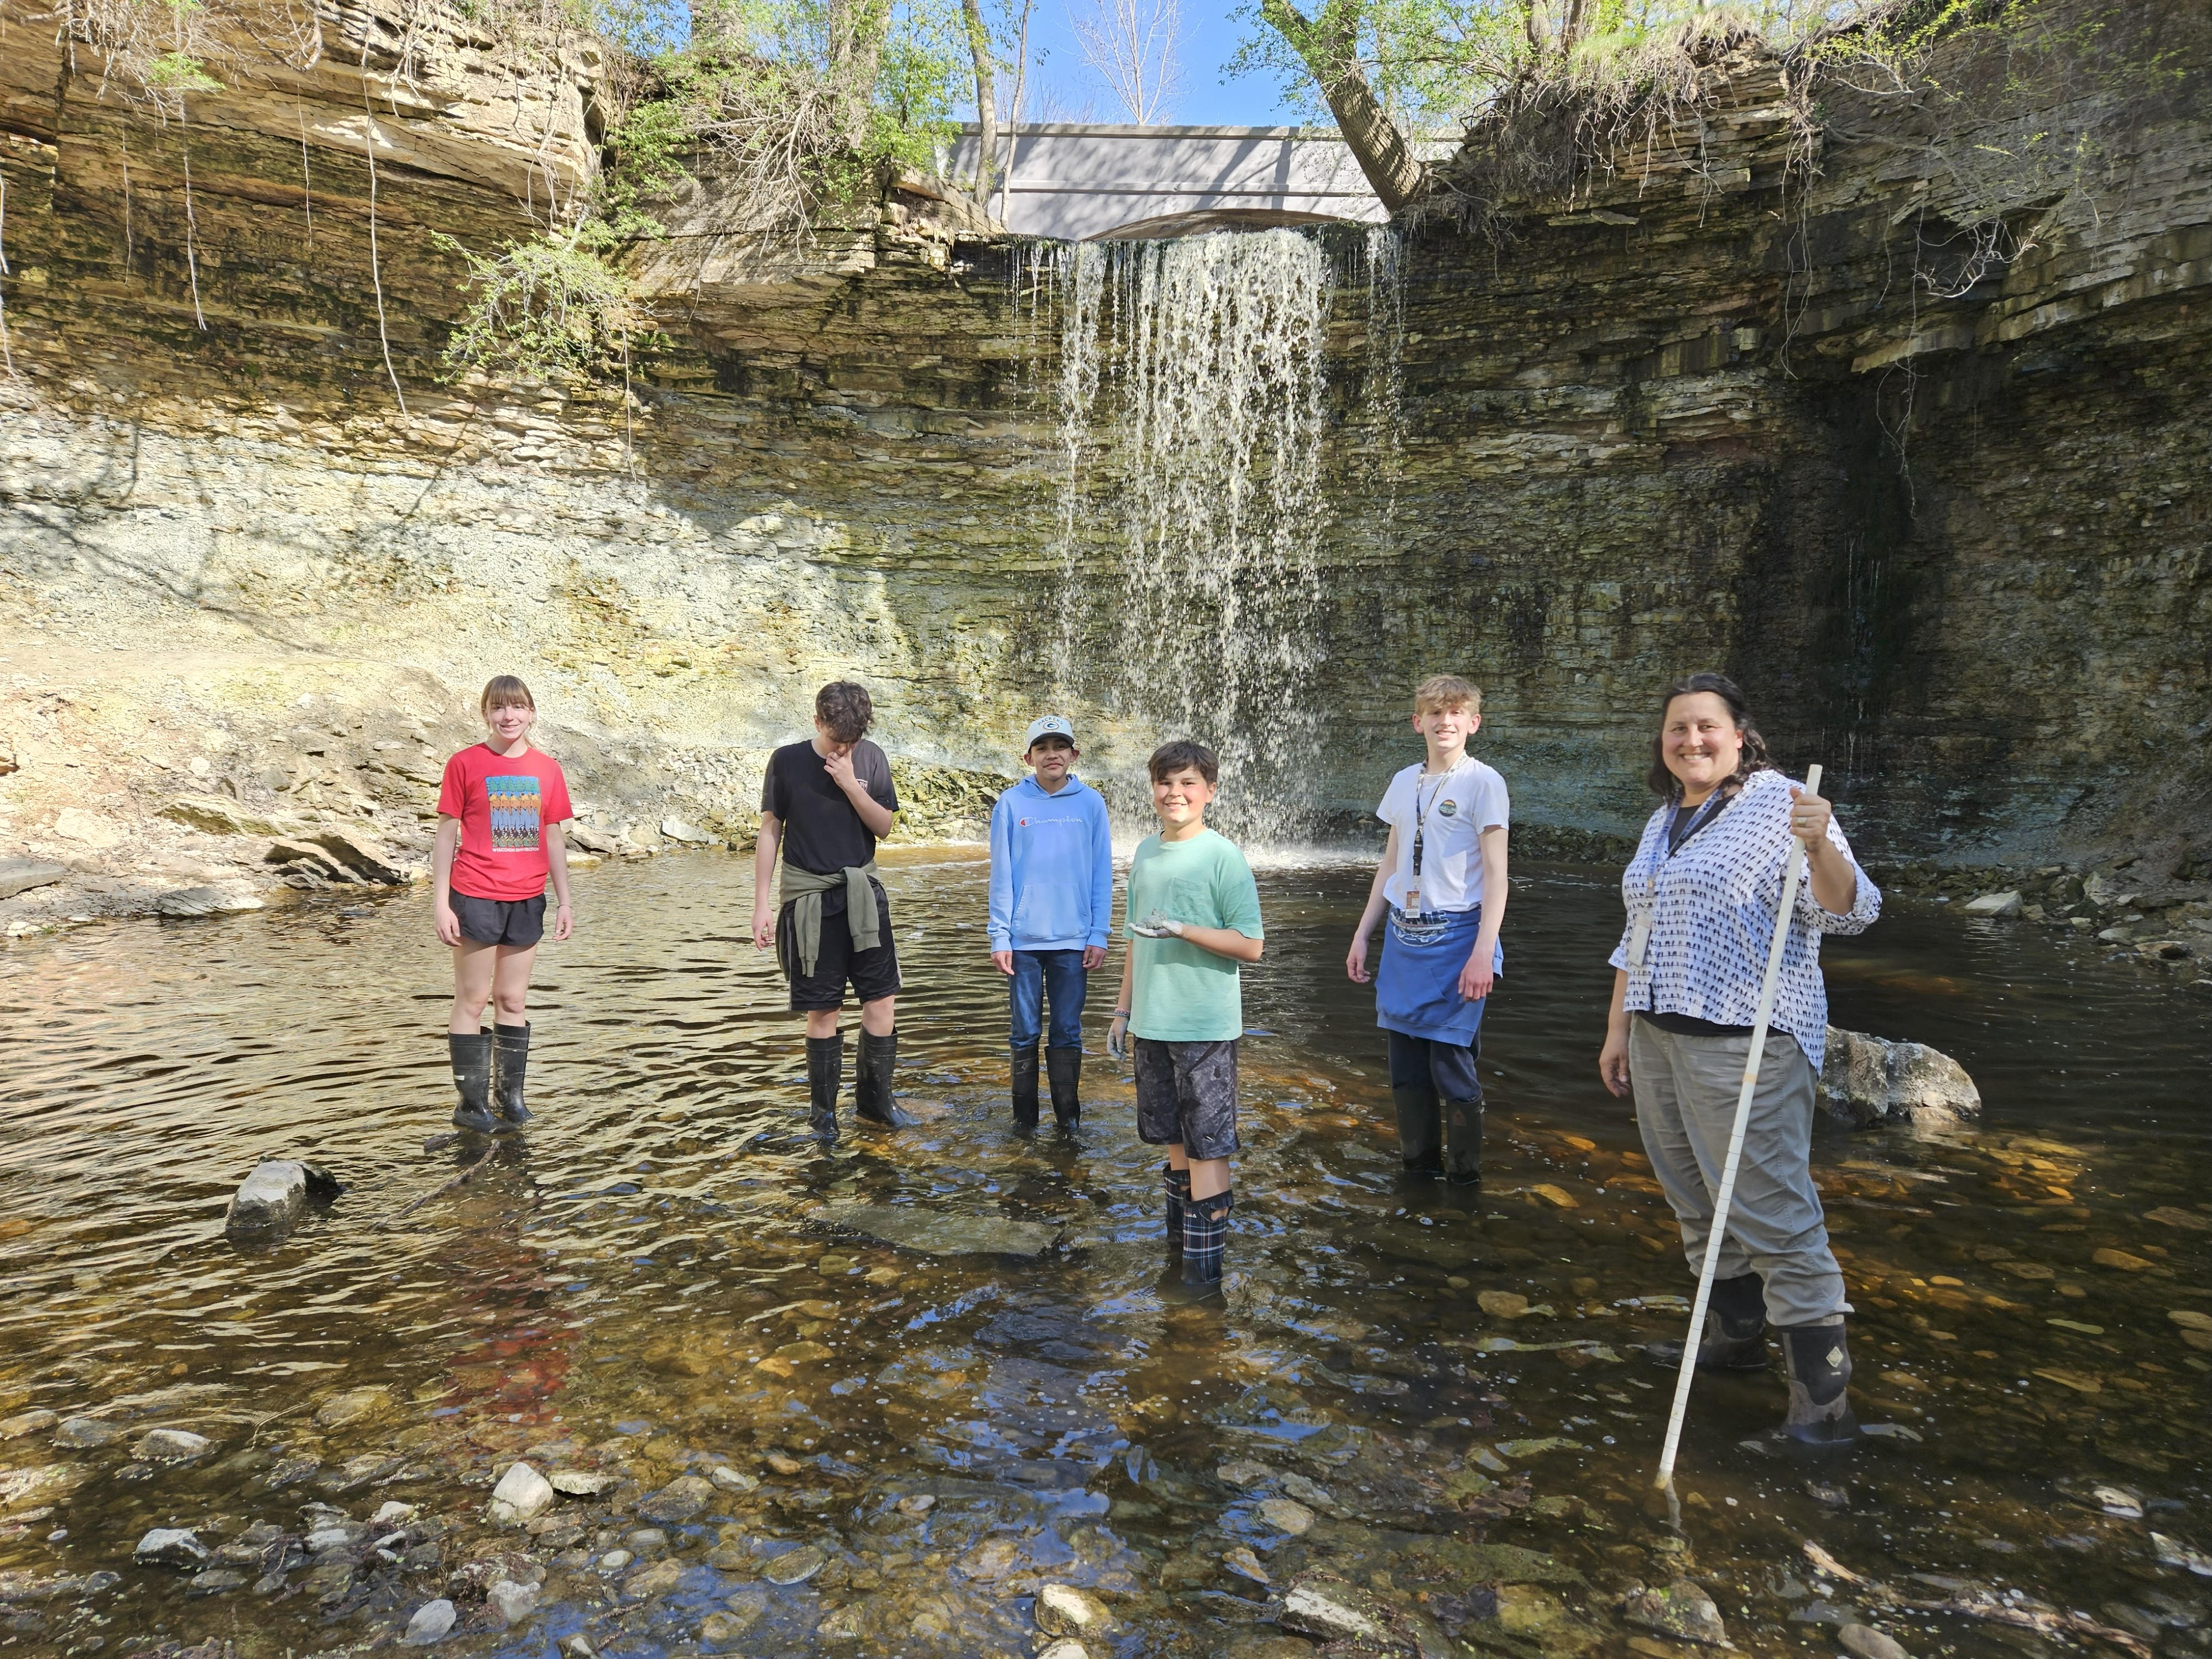
Authentic science happens when students become scientists, exploring the health of local streams with the scientific community. This collaboration creates a rich resource of water quality information throughout the Fox River Basin. Scientists, municipal leaders and students use this data to inform decision-makers and stakeholders in our community.
Who We Are
Teachers and students from local high schools complete all monitoring activities. Currently, 14 teachers and over 150 students are involved in the project. More than 2,300 students have participated in the program since 2003.
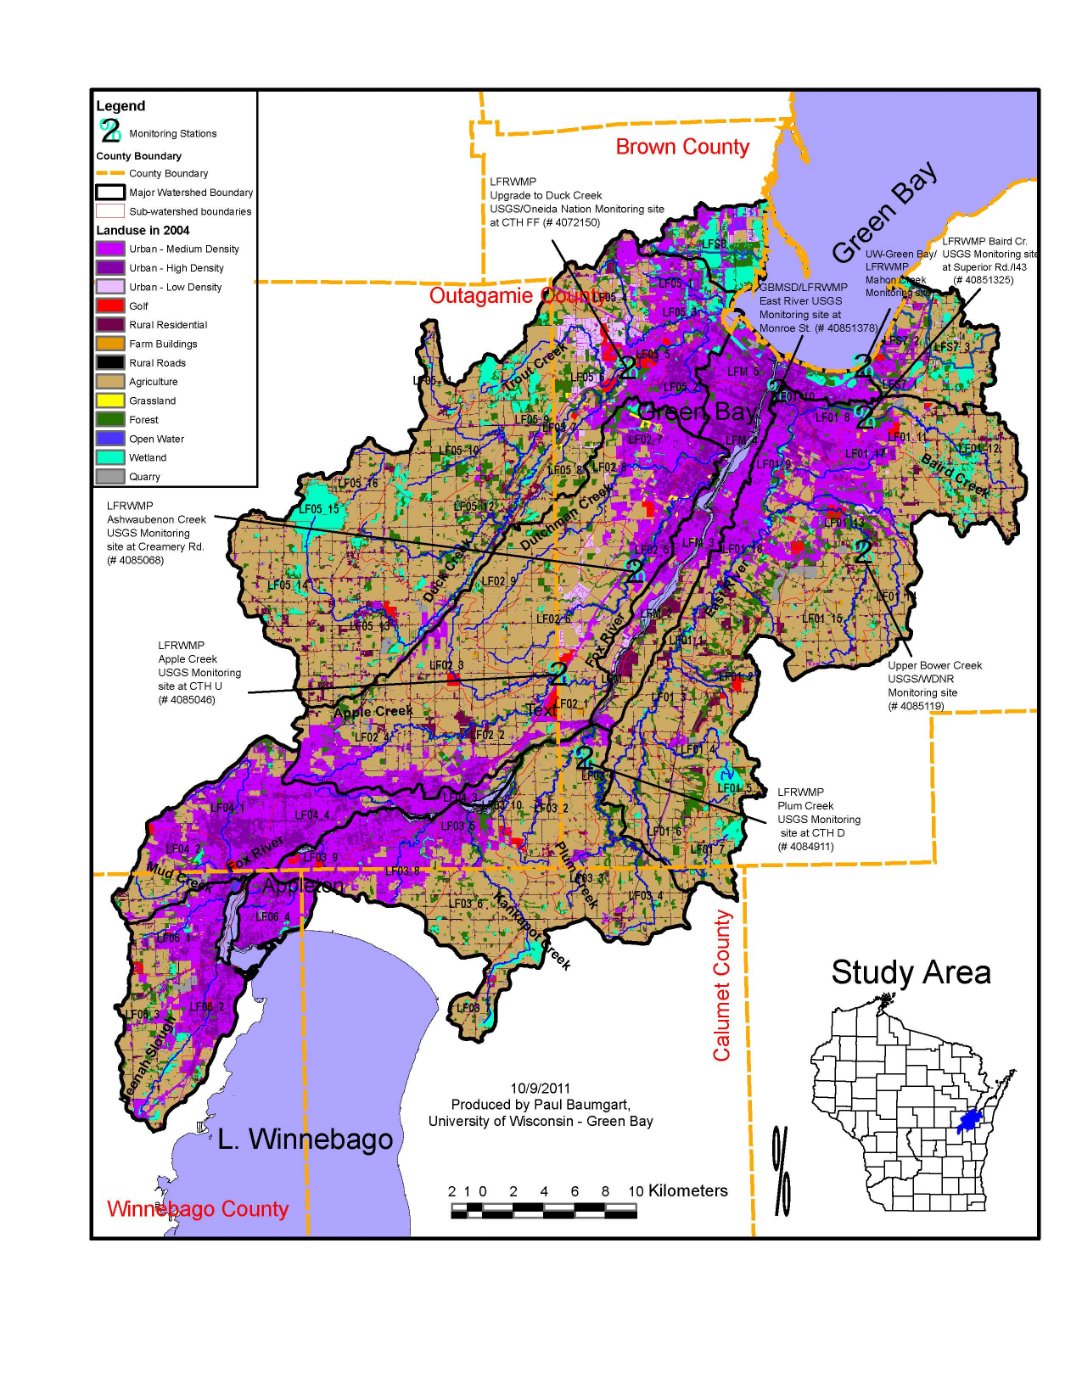
Where We Research
We monitor 11 streams, with 2 locations at each stream. Seven streams are in the Lower Fox River Basin (Apple Creek, Ashwaubenon Creek, Baird Creek, Duck Creek, Dutchman’s Creek, Neenah Creek, Mahon Creek and Wequiock Creek). Spring Brook is located on the Upper Fox River, the Waupaca River is located in the Wolf River Basin, and monitoring expanded to the Sheboygan River watershed with the addition of Pigeon River in 2022.
What We're Measuring
The teams measure water quality parameters three times per year. These include streamflow, temperature, dissolved oxygen, pH, turbidity, conductivity, ammonia, nitrates and soluble reactive phosphorus. We also measure items from the surrounding stream habitat once per year.
Definitions & Details
Calling all students and teachers working with the program! If you're wondering how to monitor your stations, find important information below. Each student-teacher team performs seasonal rounds of monitoring at two or more monitoring locations within their selected stream. Sampling is done by all teams within the same 2 to 3 week period in spring, summer and fall of each year. Most stream monitoring is performed when streams are wade-able and not affected by recent rain events.
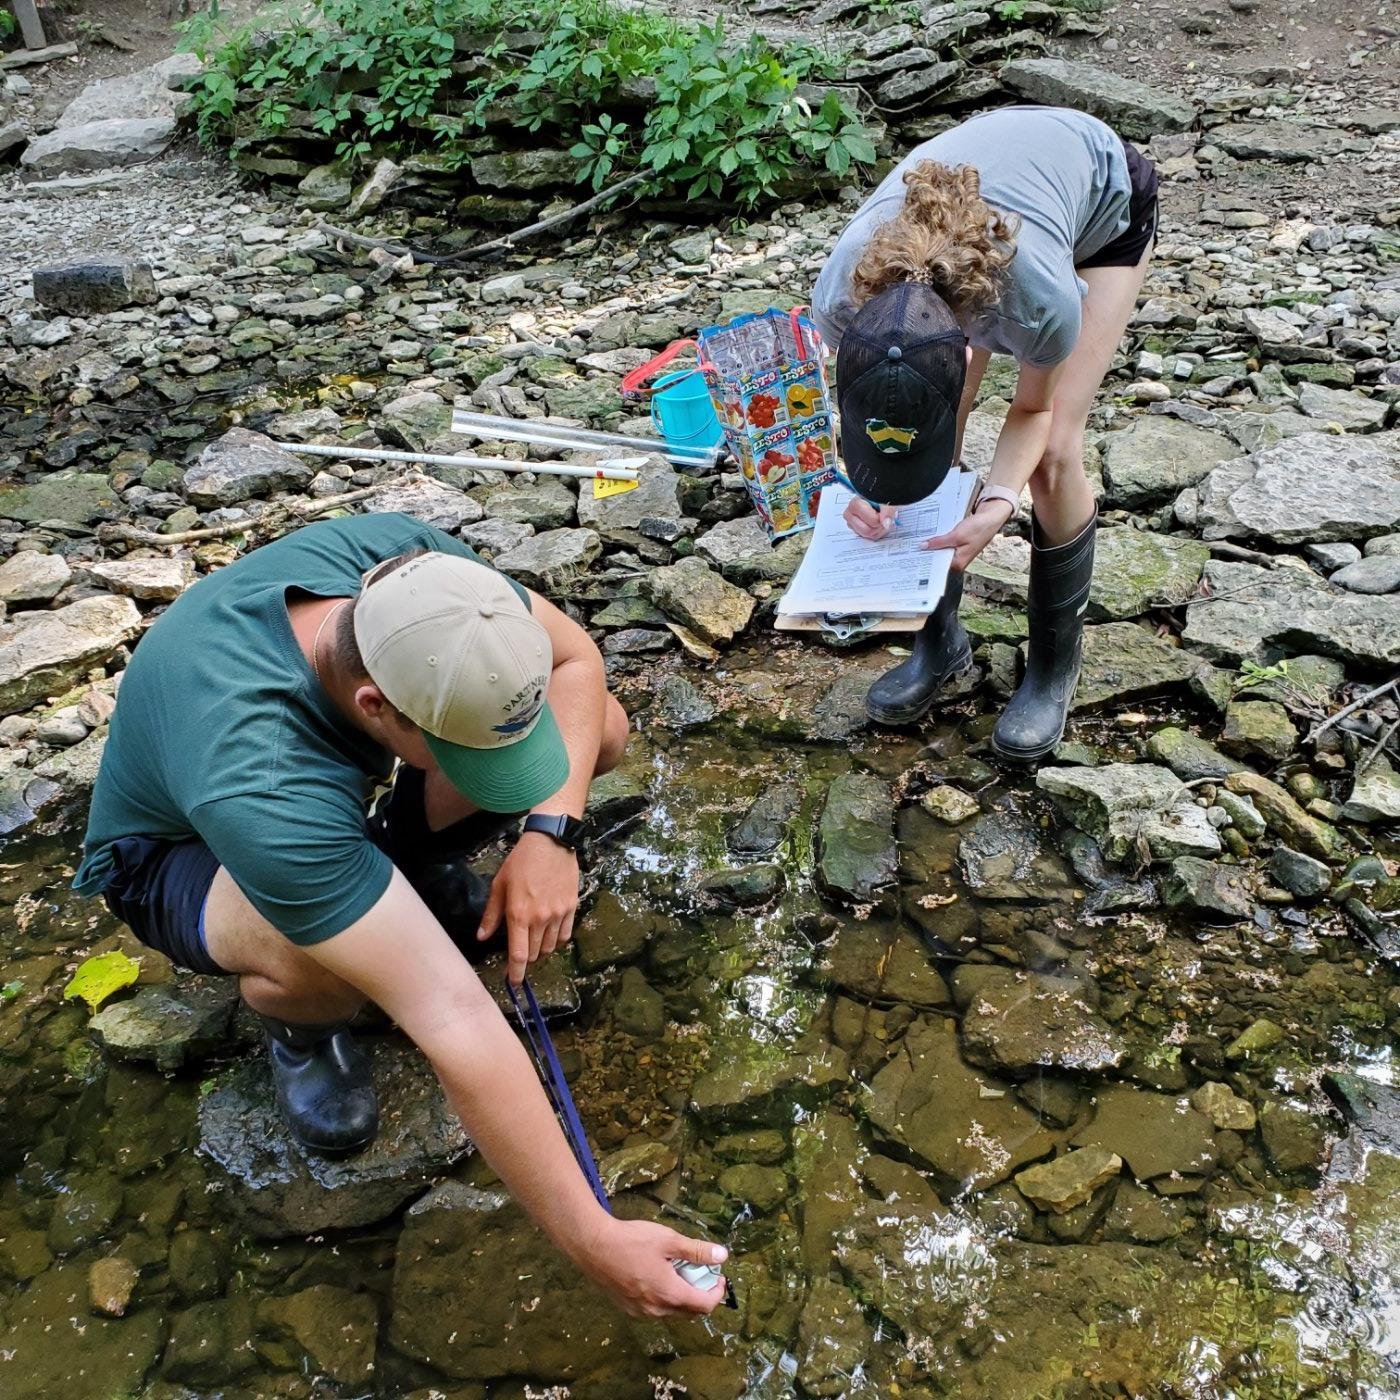
Benthic Macroinvertebrates
Macroinvertebrates are small organisms without a backbone that spend all or part of their life cycle in the water. The benthic (bottom-dwelling) macroinvertebrates supported by a stream are a great indicator of overall stream health due to their variable tolerance of pollution. Generally speaking, mayflies (Ephemeroptera), stoneflies (Plecoptera), caddisflies (Trichoptera) and riffle beetle larvae (Coleoptera) require a relatively pristine environment. Macroinvertebrates highly tolerant of pollution include midge larvae (Diptera), snails (Gastropoda), leeches (Hirundinea) and aquatic worms (Oligochaeta). Organisms such as scuds (Amphipoda), clams (Bivalvia), crayfish (Decapoda), cranefly larvae (Diptera) and aquatic sowbugs (Isopoda), are somewhat tolerant, and are found in a wide variety of water conditions.
Conductivity
Conductivity is a measurement of the dissolved ions in the water. Streams in Northeast Wisconsin typically have conductivity values between 300 and 1800 µS/cm. During periods of snowmelt or in areas where there is barnyard runoff, the conductivity in a stream may exceed the detection limits for the Oakton ECTestr+ Low Conductivity Meter provided in the monitoring kits. In these situations, the conductivity should be reported as >1999 µS/cm. Although the State of Wisconsin has not established surface water quality standards for conductivity, it can be used as an indicator of excessive ion concentrations for further study.
Dissolved Oxygen
Dissolved oxygen is the amount of oxygen available to aquatic animals. Streams in the Fox River Basin typically have dissolved oxygen values between 2 and 14 mg/L. The State of Wisconsin has set a minimum water quality standard of 5 mg/L DO as necessary for a stream to support fish and aquatic life. Trout streams may not have a DO level of less than 6.0 mg/L at any time, and may not have less than 7.0 mg/L DO during the spawning season.
Nutrients
Nutrients such as phosphorus and nitrogen are essential to maintain stream life. However, nutrient overloading into streams and lakes is one of the major challenges facing the Fox River Basin today. Excessive amounts of these nutrients throw off the ecological balance of the aquatic system, with far-reaching impacts on biota. For example, phosphorus additions to Green Bay cause huge summer algal blooms.
pH
pH measures the acidity or alkalinity of the water. The pH scale is logarithmic, meaning that every one unit of change in pH is a ten-fold increase or decrease in acidity. The pH scale in the environment ranges from 0 (acids) to 14 (bases), with 7 considered neutral. pH must be measured directly in the stream, since changes in temperature can affect the pH value. The optimum pH for most aquatic organisms is between 6.5 and 8.5. pH values outside this range may first affect reproductive processes, and then species survival.
Streams in Northeast Wisconsin typically have pH values between 7.0 and 9.0, depending on the time of year that sampling occurs. The water quality standard for most surface waters in Wisconsin to support fish and aquatic life is a pH between 6.0 and 9.0, with no change greater than 0.5 units outside the estimated natural seasonal maximum and minimum values.
Because pH is measured on a logarithmic scale, to correctly calculate an average value for replicate measurements, the values would have to be transformed logarithmically into hydrogen ion concentrations, averaged, and then transformed back into pH. Rather than perform these calculations, the median pH measurement should be reported to the LFRWMP database. pH results measured with the pH Testr 3+ should be reported to 2 decimal places.
Riparian Habitat
A riparian habitat is the vegetation that lives along the banks and corridors of rivers, lakes, and streams. Based on the EPA’s Stream Habitat Walk, the Lower Fox River Watershed Monitoring Program employs an easy-to-use approach for identifying the elements of a stream's habitat. Primarily a qualitative visual assessment, the habitat walk identifies potential water quality issues and allows observers to quickly become acquainted with their stream. For the habitat walk, the stream is evaluated by its physical in-stream characteristics, local watershed integrity, visual biological observations and an optional macroinvertebrate survey. The local watershed is examined for types of land use present, and whether particular uses are impacting the stream water quality.
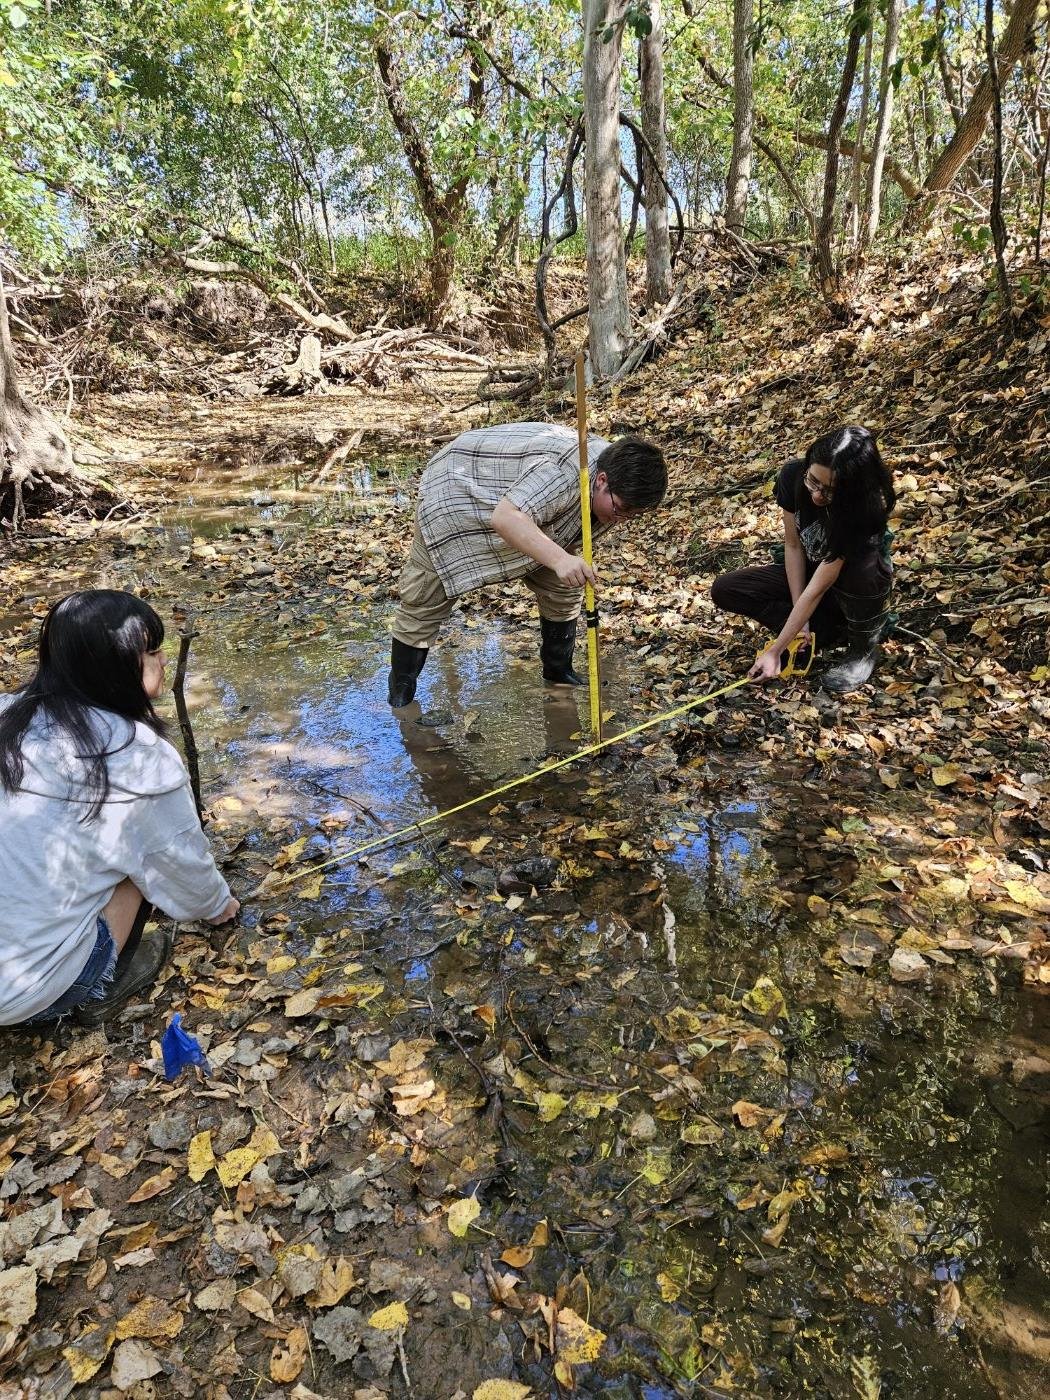
Streamflow
Streamflow tells us how much water is passing a point in a stream over a fixed period of time. For the school-based monitoring program, streamflow measurements are recorded in cubic feet per second (cfs) for ease of comparison to the data reported by USGS. Streamflow is calculated by multiplying the average width by the average depth by the average velocity by a bottom factor. To determine streamflow, a stream reach is selected that is at least 6” deep and fairly straight. The reach should contain few obstacles, and all the water should be flowing in a single channel (not braided). Velocity is determined by the time it takes to float an orange or object of similar buoyancy the length of the stream reach. Oranges work well for measuring velocity because they float just below the water’s surface, where they cannot be influenced by wind.
Temperature
Temperature affects the amount of dissolved chemicals, growth rates and survival of aquatic animals. Stream temperature can be measured with either a calibrated thermometer or with a dissolved oxygen, conductivity, or pH probe. Environmentally safe thermometers should be used to minimize the risks associated with potential mercury contamination. Data loggers which continuously record temperature measurements at set intervals may be used to show temperature fluctuations over time. For the LFRWMP, temperature measurements should be reported in °C to one decimal place.
Temperature readings for streams in the Fox River Basin typically are between 10°C and 20°C during our sampling periods. Wisconsin water quality standards state that there shall be no temperature changes that adversely affect aquatic life, and that daily and seasonal temperature fluctuations shall be maintained. By law, the temperature for warm water fisheries shall not exceed 89°F (31.7°C). A maximum temperature limit for cold water fisheries is not specified.
Turbidity/Transparency
Turbidity is a measurement of the amount of suspended particles in the water. The LFRWMP uses a transparency tube, which measures the depth at which a black and white crosshair pattern is visible at the bottom of a tube filled with stream water. Low transparency is highly correlated with high turbidity in streams. Another available method for measuring turbidity uses the Hach DR/850 colorimeter. This test reads the amount of light transmitted through the stream sample, and reports results in FAU, Formazin Attenuation Units. The most exact measurements of turbidity are made with a nephelometric turbidity meter. Turbidity meters report measurements in NTU, Nephelometric Turbidity Units, and have greater ability to determine lower levels of turbidity.
For the LFRWMP, measurements from the transparency tube should be reported in depth units of centimeters (cm). A transparency of about 25 to 35 cm is equivalent to about 25 NTU. A transparency of >60 cm is roughly equivalent to a turbidity of <10 NTU. A transparency of about 5 cm is roughly equivalent to a turbidity of about 200 – 300 NTU. A more detailed and robust relationship between turbidity and transparency for streams in Northeastern Wisconsin has not yet been developed.
"My Fox River Monitoring experience has continued to influence my education and career. I recently completed a Climate Change and Human Health elective in med school and my proposal at the end of class was focused around watershed management and monitoring in regards to ensuring safe beaches for recreation and water for drinking."

Ask an Expert
Ask Lynn Terrien, Outreach and Education Coordinator for the program. If you have questions, she can help!